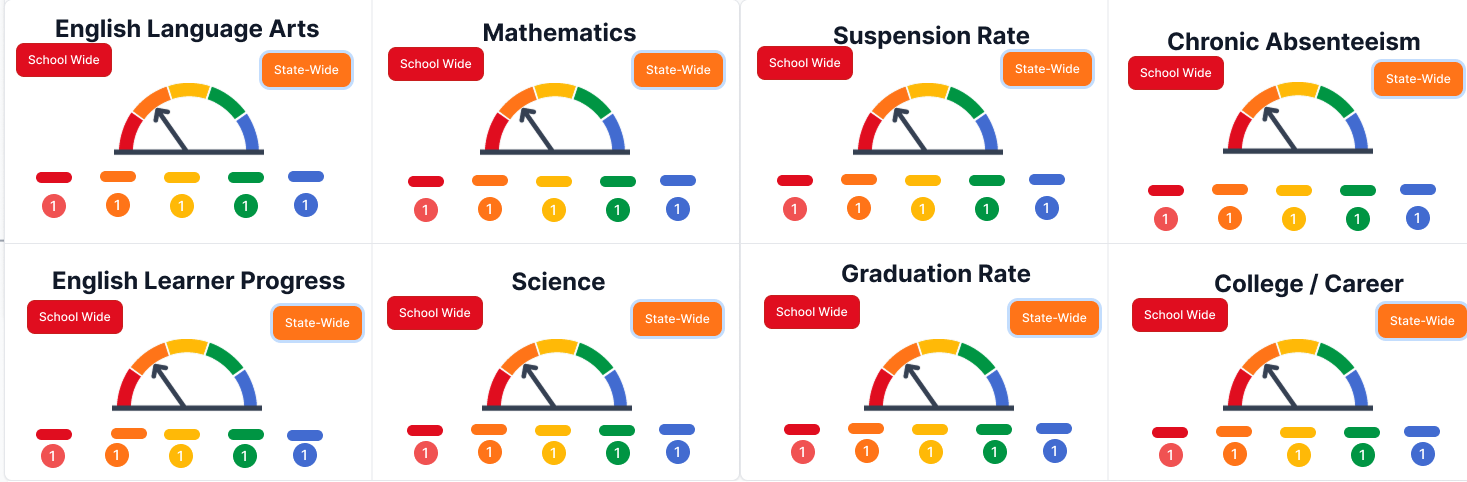
The Performance Indicators#
Cards that display the performance of local educational agencies (LEAs) on a set of state and local measures
Overview#
The Performance Cards feature is built using seven core UI components that work together to display California Dashboard accountability data in an accessible, user-friendly format.

Components#
This feature uses the following components:
StatusLevelIndicator: Color-coded performance level (Blue, Green, Yellow, Orange, Red)
ChangeLevelIndicator: Year-over-year performance change indicator
MetricCard: Container component that holds all metric information
StudentGroupBreakdown: Disaggregated data table by student demographics
TrendChart: Multi-year performance visualization
PerformanceChart: Cross-metric performance comparison in a single summary chart
DataSuppressionNotice: Privacy protection message when data cannot be displayed